Keywords
trading automation, automatic trading, systematic trading, expert-systems, software, long short, leveraged, trend following, stocks, ETFs, equity indexes trading, COSMOS portfolios.
tradingautomation is relating our experience with the development of software to ensure systematic trading and automated account management by expert systems. The system relies on trading rules and covers mechanisms enabling to identify markets, sectors or securities’ trends, to determine long / short entry signals, to handle positions sizing and management including stop policies, to care for account and money management.
trading automation, automatic trading, systematic trading, expert-systems, software, long short, leveraged, trend following, stocks, ETFs, equity indexes trading, COSMOS portfolios.
tradingautomation is a blog telling our experience with the development of software systems to ensure systematic trading and automated account management by expert systems while favouring protection and growth of capital. The system relies on trading rules, and covers mechanisms enabling to identify markets, sectors or securities’ trends, to determine long / short entry signals, to handle positions sizing and management including stop policies, to care for account and money management within agreed boundaries or safety limits (e.g. draw down, etc.).
COSMOS introduction & Objectives:
TExSOL® is a proprietary trading system:
TExSOL® basic checklist
TExSOL® basic checklist
When to avoid a market ?
Long and Short have little in common:
Position level:
Portfolio level:
A sum of stopped positions (micro vision)
The equity curve also reflects a security’s behaviour (macro vision)
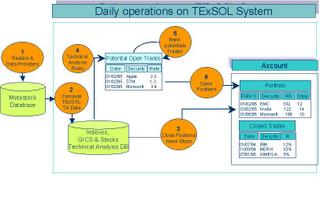
 A picture is worth a thousand words... This is a simplistic schema presenting a sequence of events that the system performs daily:
 Stocks
Indexes
COSMOS-US (Tech Stocks)
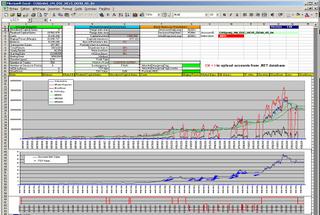
 The following upload from the .NET database in excel displays in a graphical form the results of TEXSOL trading the COSMOS-US universe (1200 securities from 6 GICS sectors) over 95-04, with various snapshot windows, the market exposure curve (red), the account equity curve (blue), the instant drawdown (black), equity curve and reflexive stops against our own account equity curve, market trend (bull=1, bear=-1, unknown=0) as the red curve in the lower window.
 The following upload of the .NET database in excel displays some trades performed by the TEXSOL trading expert-system on the COSMOS-US trading universe, with the security name, number of securities Bought Long or Sold Short, open date & price (L/S), close date & price, realized capital gains (loss), and in % P&L, open rule used, close rule used including stop types, stop types, stop value, type of trade (L/S), nR multiple, ISL, margin.
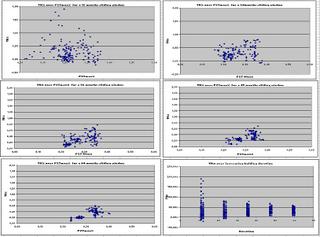
 The following charts give the results of a parametric study over 720 runs, reporting YR% (yearly returns %) versus Peak-to-Through (P2T%) for increasing trading durations (12, 24, 36, 48, 60 months) and shows how the TEXSOL trading expert system performances converge towards the expected probability, center of gravity of the distribution on 60months with YR%(40%) and P2Tmax(35%).
 The following gives a summary of the returns made on US market by the TEXSOL system over increasing timescales up to 60 months for thousands of monte-carlo runs and illustrates that for timescales longer than 36months no negative returns (min) are observed. Average, max and min returns are displayed for each windows. Such tests run for over a week on a fast P4 with SQL server.
COSMOS-NDX (Index trading)


COSMOS-ETF-US (ETF trading)

Daily operations include:
Managed Account mode:
To understand the basics behind the design of the TEXSOL trading expert system, we recommend the reading of the following books, papers and documents.
